"Antarctica, home to the coldest place on Earth, experienced a worrying heat wave earlier in February, possibly even setting a record high temperature for the normally frigid continent. A NASA satellite has taken stock of what that heat meant to the local ice cap and glaciers.
OMG!! MELTWATER IN THE ANTARCTIC!!
NASA's Earth Observatory released two images from the agency's Landsat 8 satellite. They highlight dramatic changes in the ice and snow along the northern tip of the Antarctic peninsula.
A close-up look at Eagle Island on Feb. 4 showed plenty of snow coverage. A follow-up view from Feb. 13 revealed bright-blue melt ponds and exposed ground.
"I haven't seen melt ponds develop this quickly in Antarctica," said Mauri Pelto, a glaciologist at Nichols College in Massachusetts, in a NASA post on Friday.
Eagle Island isn't far from Argentina's Esperanza research base where a record high temperature was logged.
A World Meteorological Organization committee is working to verify the record temperature reading, but the results of the warm spell are easy to spot in the satellite views. The heat wave liquefied around 20% of Eagle Island's seasonal snow accumulation in a matter of days.
The heat and related meltwater formation is part of a pattern. "If you think about this one event in February, it isn't that significant," said Pelto. "It's more significant that these events are coming more frequently."
The Truth of So-Called Antarctic "Melting"
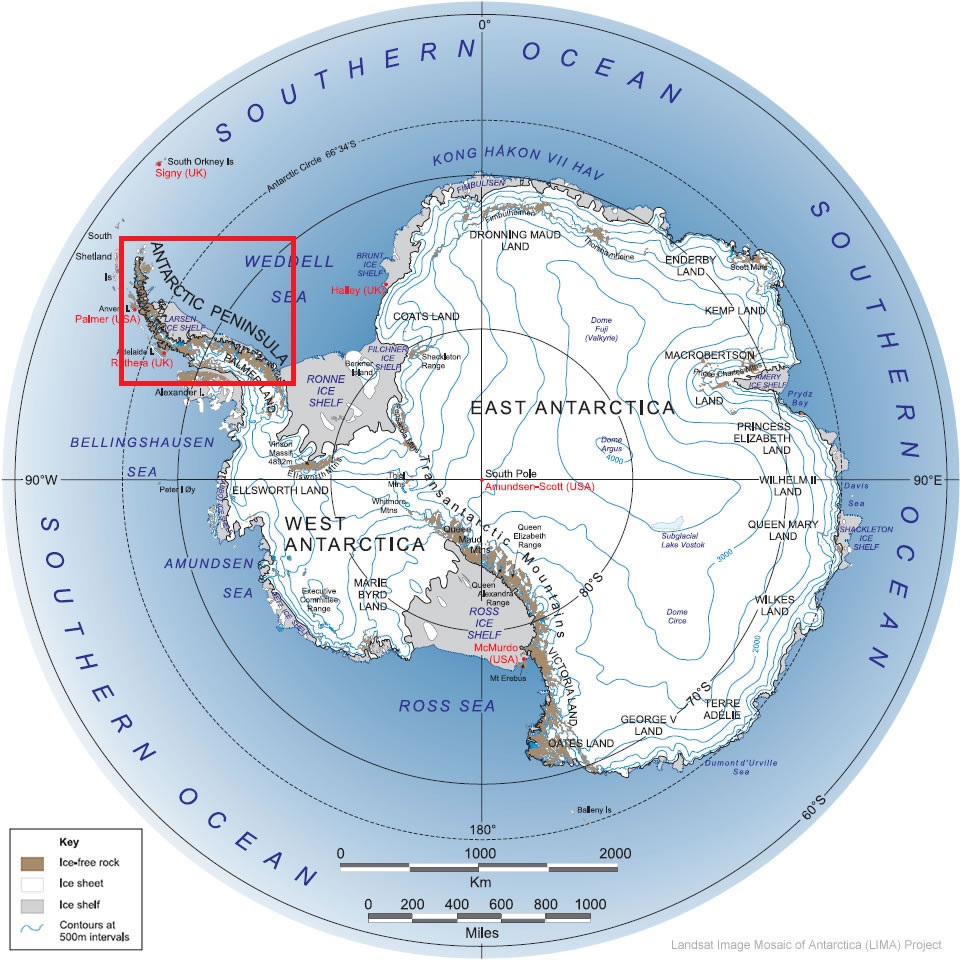
At first glance, you would be led to think that the picture shown is a satellite image of the Antarctic Continent. The truth is that it's an image of Eagle Island at the very end of the Antarctic Peninsula, far outside of the Antarctic Circle (shown as the 63' S latitude)! Eagle Island is closer to Argentina than the Antarctic Continent!! Esperanza Base is at the tip of this peninsula.
Antarctic Peninsula Showing Eagle Island in Red
Antarctic Continent Map Showing Antarctic Peninsula Highlighted in Red
Even on Eagle Island, there are only two months in the year where the daily highs reach above freezing. Even in the warmest months, daily lows are well below freezing. Esperanza Base, located in the northernmost and warmest part of Antarctica, at the tip of the Antarctic Peninsula (Eagle Island), at a latitude of 63 ° south, the temperature is even higher, in fact, the daily average ranges from a low of -10.5 °C (13 °F) in June to a high of 1.5 °C (35 °F) in January. The cold record is -38.4 °C (-37.1 °F).
The picture exposes the entire fantasy reality of very expensive all-electric cars, especially if that gen-set shown below is powered by natural gas. Presumably it's in some rural area or the outback of Australia? You see, some 65% of US power comes from fossil fuels and most of the rest comes mostly from hydroelectric and nuclear. (Wind power is a surprising 5.7% these days, with Solar power is less than 1%--see chart below.)
The Approximate Reality of Electric Cars
I found a used 2018 Tesla Model 3 with long range batteries for sale in Houston with only 7,600 miles on it for $45,500. Not bad. With 60 month financing at 3.99% and 10% down payment, it costs $754 per month. If anything goes wrong, I'm not sure about warranty issues with this used car.
Then I went to GEICO, who insures my plebeian Toyota Camry, to price comprehensive car insurance for this Tesla. The cost was $991 per 6 months or $165 per month.
So, to buy a used long-range Model 3, it will cost $919 per month to get it on the road (financed). Yes, you might save $100 to $150 per month in gasoline costs assuming the electricity cost is nil, but is it worth it??
You're not really saving the planet either, since most electricity is generated from fossil fuels. Also, the cost of the vehicle itself reflects the embedded energy in the manufacture of the car which is at least twice as high as an internal combustion alternative up to 3 or 4 times that cost. So, you're emitting at least twice the CO2 emissions in buying one of the cheapest all-electric cars. The expensive ones caused 3 or 4 times the CO2 emissions of a similar conventional car --which is reflected in it's price. (For example, the final cost reflects the energy in mining the various materials, the refining and transporting of the materials to factories, human energy and capital in the manufacturing-which requires energy, and transport to the end buyer. The final price reflects all of the costs of: 1) human energy, 2) electric power energy and 3) fossil fuel energy to mine and refine the raw materials and assemble each unit -- the total manufacturing and delivery process.)
In 1970, US debt was $275 Billion. It took 188 years to achieve that. Now, the US is selling that amount of debt every month, or even in a week!
Worse, it's just recently selling most of it to the US Federal Reserve (another part of the government). That's called debt monetisation and is the stuff of the Weimar Republic except all these money transactions are only electronic accounting transactions that create bank reserves rather than issuing paper money.
We really have just "funny money" (fiat money) not based on anything but confidence and faith in the government. How long do you think that can last? It's already coming to an end as investors are chasing hard assets like crazy now; like housing, gold, stocks. Inflation is raging in those assets.
Background
After WWII, the US was the only major economy that emerged from the war with prosperity and a robust economy. We also had huge gold reserves since we had enjoyed huge trade surpluses with the world before and during WWII. The Bretton Woods arrangement was established in 1944 among the Allied powers where the US dollar, backed by gold, was the de facto global monetary standard. And it worked very well.
But in 1971, Nixon ended this monetary arrangement which ended gold-backed money. It was done at that time to enable the government to run deficits to fund the Viet Nam war without raising taxes to pay for it. As an immediate result, the US dollar plunged in value and our national debt and inflation began to skyrocket. A falling dollar soon caused the oil exporting countries to sharply raise oil prices in 1974 igniting a budgetary and inflationary spiral.
Then came decades of huge, unsustainable global imbalances in trade and debt, inflation, falling living standards, inequality, monetary disorder, instability, the rise of China, the Petro-dollar, endless wars, the massive military-industrial complex, a leviathan surveillance state, mega corporate monopolies, massive US government growth, government malfeasance and corruption, national de-industrialization, wealth inequality, the Eurodollar rise and fall, widespread US intervention and manipulation in nearly every global nation -- continuing to the present day. All fueled by easy (unsound) money and out-of-control spending.
It didn't have to be that way. Those persistent budget and trade imbalances over the past several decades could never have happened with "sound" money, as the deficit nation would have seen a loss of gold (money) that would have slowed the economy and reduced imports to a balance with exports. And debt creation would have been severely limited since new money would have to be backed by gold-- and the quantity of gold is limited. Exchange rates would have been very stable too. Trade wars, kinetic wars, trade and budget deficits don't exist with a gold standard. That is the beauty of a world-wide gold standard. That's also why gold standards rarely last long.
Everything is a lie or a false meme these days in the media, in political circles, and with the government and UN. Here's a video presentation from well known Dr. Don Easterbrook who debunks the various lies and manipulations regarding what was formerly known as Global Warming, now "Climate Change" because warming has paused for the past 18 years. It's about an hour in length.
Sea level is rising 7 inches per CENTURY, not 20 feet. The oceans have risen 400 feet in the past 10,000 years-- all natural!!
Severe storms and hurricanes are NOT more frequent than long term averages.
Arctic and Antarctic ice extent are in normal ranges of the past 100 years.
Antarctic ice sheet is arguably growing, not melting at all.
The vast ice sheet of Greenland is between 1 1/2 to 2 miles thick (7000 to 10,500 feet elevation). Temperatures at that elevation in the arctic are NEVER above freezing even in the summer. Therefore the vast majority of Greenland ice is NOT melting. It can't! (See below)
The Antarctic is similar to Greenland where nearly all of the continent remains below freezing --even in their summer. (See below.)
There hasn't been any global warming overall in the past 15 years.
The 1930s was the warmest decade in the past century, NOT our current period.
Snowfall is not below normal. Four of the past 5 years have set snowfall records.
CO2 is a trace gas at 0.04% (400 ppm), up from 0.03% (300 ppm) in 100 years. It's not enough to cause warming.
We are led to believe that warming is occurring because NOAA and NASA keep manipulating data to reduce the high temperature extremes of the 1930s and increase ("adjust") recent data warmer.
The Oceans are alkaline and will never acidify. The oceans have an alkaline pH of 8.3 (below 7.0 is acid, above 7.0 is alkaline). The pH will never drop because the ocean is a massive carbonate and bicarbonate buffer system that will eventually absorb all excess atmospheric CO2 to an atmosphere equilibrium concentration near 280 ppm CO2.
Antarctic Climate
The average temperatures of the continent are extremely low. Some 99% of the continent is continually below freezing even in their summer (January). There is no evidence of any shrinkage in the continents ice sheet and maybe good evidence of it gaining in extent. (Source: https://www.climatestotravel.com/climate/antarctica)
South Pole
At the South Pole, 2,800 meters (9,200 feet) above sea level, the average annual temperature is -49 °C (-56 °F), ranging from about -28 °C (-18 °F) in January to about -59.5 °C (-74.5 °F) in July. The lowest recorded temperature is -83 °C (-117 °F), while the highest is -12 °C (10 °F).
Here are the average temperatures of the South Pole (Amundsen–Scott Station).
South Pole - Average temperatures
Month
Jan
Feb
Mar
Apr
May
Jun
Jul
Aug
Sep
Oct
Nov
Dec
Min (°C)
-30
-43
-57
-61
-62
-63
-63
-63
-62
-54
-40
-29
Max (°C)
-26
-38
-50
-53
-54
-54
-55
-55
-54
-48
-36
-26
Min (°F)
-22
-45
-71
-78
-80
-81
-81
-81
-80
-65
-40
-20
Max (°F)
-15
-36
-58
-63
-65
-65
-67
-67
-65
-54
-33
-15
Vostok
However, the lowest temperature ever recorded in the continent, which is also the world record, belongs to the Russian station of Vostok, 3,500 meters (11,500 feet) above sea level, where the temperature reached as low as -89.2 °C (-128.6 °F) in in 1983. Here, the highest temperature ever measured is -14 °C (7 °F). This station is located near the geometric center of the continent, which is decisively indicating that continentality is a determining factor in temperature distribution, even more than latitude.
Here are the average temperatures of the Vostok station.
Vostok - Average temperatures
Month
Jan
Feb
Mar
Apr
May
Jun
Jul
Aug
Sep
Oct
Nov
Dec
Min (°C)
-38
-50
-62
-68
-69
-69
-70
-72
-70
-63
-50
-38
Max (°C)
-27
-39
-53
-61
-62
-61
-62
-64
-62
-52
-37
-27
Min (°F)
-36
-58
-80
-90
-92
-92
-94
-98
-94
-81
-58
-36
Max (°F)
-17
-38
-63
-78
-80
-78
-80
-83
-80
-62
-35
-17
There are also inland areas, with no weather stations, where even lower temperatures have been measured by satellites, such as Dome A, located at 4,000 meters (13,000 feet) above sea level, where a temperature of -93 °C (-135 °F) has been estimated.
In coastal regions, the climate is much milder. This happens because of the lower latitude (in some areas, the coasts are beyond the polar circle) and of the lower altitude (unlike in the interior, where there is a thick ice cap, here we are obviously at sea level), as well as of the influence of the sea. Here, the temperatures rarely drop below -30 °C (-22 °F) even in winter, while they can exceed the freezing point in summer. The highest temperatures ever measured in the continent have been 14.5 °C (58 °F), recorded on January 5, 1974, in the former Vanda Station, located near a salt lake in the McMurdo Dry Valleys, at a latitude of 77 degrees South, and 17.5 °C (63.5 °F), recorded in the Argentine Esperanza base in March 2015 (see below).
The Australian Casey Station is located on the coast of the Indian Ocean, at a latitude of 66 degrees South. Oddly, the average temperature at Casey Station reaches its minimum of -15 °C (5 °F) in May, probably for the change in atmospheric circulation that occurs in winter, while it peaks around -0.5 °C (31.5 °F) in January.
Casey - Average temperatures
Month
Jan
Feb
Mar
Apr
May
Jun
Jul
Aug
Sep
Oct
Nov
Dec
Min (°C)
-3
-5
-10
-15
-19
-18
-18
-18
-17
-15
-9
-4
Max (°C)
2
0
-4
-8
-11
-10
-10
-10
-10
-8
-3
1
Min (°F)
27
23
14
5
-2
0
0
0
1
5
16
25
Max (°F)
36
32
25
18
12
14
14
14
14
18
27
34
At the Esperanza Base, located in the southernmost and warmest part of Antarctica, at the tip of the Antarctic Peninsula, at a latitude of 63 ° south, the temperature is even higher, in fact, the daily average ranges from a low of -10.5 °C (13 °F) in June to a high of 1.5 °C (35 °F) in January. The cold record is -38.4 °C (-37.1 °F).
Greenland Climate
In the interior, covered by the ice cap (Section 3 of map figure), the temperature remains around freezing or below even in summer, and it decreases with altitude. In summer, it usually snows above 300 meters (1,000 feet) above sea level. The coldest areas are the central ones, where the ice cap is thicker. So there can't be any melting for the vast majority of Greenland!! (Sources: here, Also: here.)
Eismitte
For instance in the point called Eismitte, at the center of the island, about 3,000 meters (10,000 ft) above sea level, an expedition in 1930 installed a weather station, which recorded an average temperature ranging from -47 °C (-53 °F) in February to -12 °C (10 °F) in July. The lowest recorded temperature was -65 °C (-85 °F) and the highest was -3 °C (27 °F).
Summit Camp
In the more recent scientific station of Summit Camp, located near the highest point of the ice plateau, where the altitude reaches 3,200 meters (10,500 ft), the average temperature ranges from -42 °C (-44 °F) in January to -13 °C (9 °F) in July; the coldest record so far is -67 °C (-88.5 °F), while the highest has been 3.6 °C (38.5 °F). Here are the average temperatures: