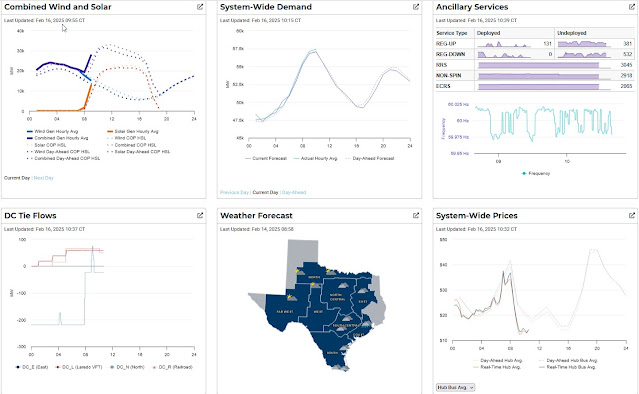
This is a snapshot of the Texas-wide power grid on a clear, cold February morning; best viewed on your desktop computer.
You know that I’m a big nerd, right?? I’m interested in stuff that most people aren’t. Just for the fun of it, I thought I’d share the online ERCOT power grid supply and demand situation on this Sunday morning. The website is here: Grid and Market Conditions. You can bookmark it and have a look. Occasionally, I take a peak at it.
It’s turned cold across the state after about 10 days of very warm weather. I’ve been running my air conditioning. I turned my heat on briefly this morning.
It’s sunny across the state and winds in most places are fairly light breezes—even in the wind turbine areas in the high plains of NW and W. Texas. Here’s the power balance live on the Internet (click to enlarge, or link direct to the Website):
 |
| click to enlarge |
And the bottom of the page:
 |
| click to enlarge |
The main thing that I’m often looking at is the power generation mix and reserve capacity. Right now, wind is generating 11,000 MW out of 39,500 MW capacity), solar is generating 22,700 MW (out of 28,800 MW capacity) for a grand total of 61.6% of the total power produced. Yep, it’s a sunny day but the wind is not very high.
The balance of the power supply is Natural Gas generation at 10,300 MW (out of a 68,000 MW supply; WHOA, big capacity!), Coal is 5800 MW (out 14,700 MW capacity) and Nuclear is steady at all times at about 10% of the grid supply (rock solid and at 95% of capacity.
When the sun goes down and winds are light, Natural Gas takes the star role in power generation, and can COMPLETELY cover 0% solar and 0% wind. Nuclear remains steady and Coal can also increase. I’ve mentioned in many of my blog posts that wind and solar generation requires a 100% backup; thereby greatly increasing the costs of power. How can it not when you’re DOUBLING the capital cost of generation??? It COULD be much cheaper without GLOBULL WARMING!!
At this moment, there are 12,758 MW of operational reserves available = plenty of excess capacity.
TYPICAL GRID PROBLEMS WITH WIND AND SOLAR SUBSIDIES
If wind and solar get subsidies and/or preferential status on the grid, and they are indeed preferred (you know GLOBULL WARMING!!), with natural gas generation is very low at this moment, this means that the natural gas generating and coal generating utilities lose revenue and THEY END UP REQUIRING SUBSIDIZES also.
When you are in the grips of GLOBULL WARMING!! hysteria, then ALL POWER PRODUCERS GET SUBSIDIES and power prices to the consumer ARE HIGHER than if no one gets subsidies.
But Retail power costs to the consumer in Texas don’t seem too high, but they would be lower if EVERYONE producing on the grid aren’t getting subsidies. I’ll say again that I don’t know the contractual situation here in Texas and it can’t be too ridiculous as power costs to the consumer runs about $0.15 per Kw-hr, or not that high or better than Germany or Hawaii which are astronomic at $0.40 to $0.44 per Kw-hr.
Here’s the wholesale power prices for the electric companies. It’s pretty reasonable this morning, but it’s a quiet morning. The light blue at $20 is $20 dollars per megawatt-hour ($/MWh) or $0.02/KW-H WHOLESALE PRICE. The consumer pays about $0.15 per KW-Hr. I remember it being about $0.10 or $0.12 per KW-Hr, so it’s elevated and/or inflated by GLOBULL WARMING!!. Are you happy about that???
Here’s the website’s notes about wholesale power costs shown above:
Real-Time Market
Wholesale Prices are displayed in the Real-Time Locational Prices map, offering a dynamic view of Real-Time resource node Locational Marginal Prices (LMPs) and both Day-Ahead Market and Real-Time Settlement Point Prices throughout the ERCOT region. The dashboard also includes the Real-Time Price Adders (listed outside the map):
On-Line Reserves
Off-Line Reserves
Reliability Deployment
Data Displays
The Real-Time Locational Prices map has three data displays:
Real-Time LMPs (RTM-LMP)
Real-Time SPPs (RTM-SPP)
Day-Ahead SPPs (DAM-SPP)
View Types
The map has two view types:
Standard Gradient
High Gradient
Standard Gradient represents 34 preset contour levels from -$250 to $9000. High Gradient represents 34 contour levels determined by the min/max values of the data.
Real-Time LMPs are updated after every SCED run. Real-Time SPPs are updated every 15 minutes. Day-Ahead SPPs are updated daily when DAM closes. The automatic browser refresh rate is every 5 minutes for RTM-LMP and RTM-SPP; DAM-SPP is refreshed every hour. All prices are in dollars per megawatt-hour ($/MWh).
The data provided in this dashboard is available in report format as follows:
NP6-788-CD, LMPs by Resource Nodes, Load Zones and Trading Hubs
NP6-905-CD, Settlement Point Prices at Resource Nodes, Hubs and Load Zones
Note:
The data and prices provided are preliminary. Such information should
not be relied upon for settlement or other purposes. ERCOT makes no
representations or warranties regarding the correctness or veracity of
the data and prices provided through dashboards and shall not be
responsible for any party's reliance on any such information.

No comments:
Post a Comment
Please send me your message or comments. Thanks in advance.